论文总字数:14961字
目 录
摘要: 1
Abstract: 2
1.引言 3
2.研究材料与方法 4
2.1研究区域介绍 4
2.2数据来源 4
2.3 研究方法 4
3.结果 5
3.1 EVI多年平均值的空间分布特征 5
3.2 EVI的时间变化规律 6
3.3 物候参数的空间特征 9
3.4 EVI和物候参数的年际变化趋势 10
4.结论与不足 12
参考文献 13
致谢 15
城市植被指数及物候参数的变化规律研究——以悉尼为例
项马青
,China
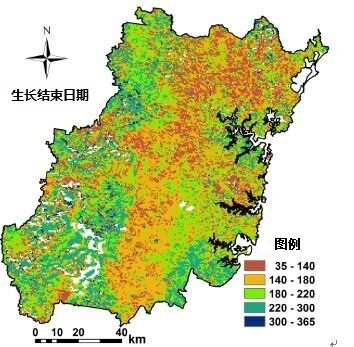
Abstract: Based on land cover and enhanced vegetation index (EVI) data, this paper analysed the spatio-temporal features of growth condition of vegetation and phenological parameters in the Sydney City, with the ArcGIS and timestat softwares. Comparisons among different land cover types were also made. Results showed that spatial distribution of EVI was closely related with land cover types. Urban had the lowest EVI, and its values growed larger with the distance from the center of the city. Forest had the highest EVI values, and other land cover types had similar EVI values. Generally, the peak of EVI in a year occurred in summer, while the valley occurred in the winter. From 2001 to 2012, EVI in the center of the city had an increasing trend, which illustrated that vegetation growth was promoted there. The north and western regions of Sydney had decreasing EVI trend, where urbanization was undergoing. Forest had the most complicated changing feature, including both of increasing and decreasing trend. For the phenological parameters, forest had the earliest start of life cycle, and the latest end of the life cycle, and thus the longest lasting days of life cycles. Urban had the secondary life length, with late start of cycle but also late end of cycle. Grassland, Cropland, and Savanna had the shortest life cycle, with early start of cycle and also early end of cycle. During 2001-2012, there were advancing trend for both of start of cycle and end of cycle, and shortening trend for the length of life cycle, in the most region. These results were helpful for the researches on sustainable development and the response of land ecosystems to urbanization.
Keywords: enhanced vegetation index, start of life cycle, end of life cycle, length of life cycle
1.引言
目前,世界上约有52%的人口居住在城市地区。随着世界性城市化、工业化进程的加快,城市人口密集,经济发展快,能耗量多,空气污染重。这种高速城市化使城市生态气候发生了明显改变,最突出的表现是城市热岛效应明显[1]。
物候是用于反映气候对植被影响的一个工具[2]。可以通过物候如发芽期、开花期的变化,来研究气候变化规律及其对生态系统的影响。植被物候现象是环境条件季节和年际变化最直观,最敏感的生物指示器[3]。研究城市化引起的物候期变化,将有助于提高我们对气候与植物相互作用机理的理解[4]。物候的研究还有利于净初级生产力的计算[5],低层大气中的能量和质量平衡分析[6],以及多尺度植物动态变化研究[7]。
世界上已经有许多关于城市植被生长变化的研究,遍布欧洲、北美和亚洲[7-12]。这些研究清晰地表明,由于城市的高温影响,植物在城市的开花期要比在农村早[13]。例如,在欧洲城市地区开花期平均比农村地区早4-17天[14-15] 。Neil等使用植物标本记录表明,在美国西南部地区的Maricopa县城中心大部分植物的开花时间早于周边地区[16]。Mimet等观察到在法国的Rennes市悬铃木和酸樱桃在城市中心的开花时间要早[17]。Lu等发现北京早期开花的物种比在晚期开花的物种对温度的响应更敏感,这是因为城市热岛效应在冬季和早春比春末和初夏更明显[18]。欧洲的国际物候观测数据网的监测数据表明,在1959 - 1996年期间,春季的物候平均提前-0.21天/a,而秋季物候平均延迟 0.15d/a[19]。Roetzer等发现在欧洲中部,城市的植物开花期比周围农村地区要早约2-4天[20]。
这些传统的地面观测研究方法具有很高的时间分辨率,但是不利于宏观动态的空间分析。遥感数据的应用可以弥补这方面的问题。卫星遥感技术的出现使得人们有可能在宏观尺度上研究植被动态变化[21]。这样的研究有利于物候变化的机理研究和物候模型的建立,这也是未来研究的重点领域[22-30]。
关于遥感监测植被物候也有了一定的研究基础。White使用AVHRR(甚高分辨光谱辐射仪)数据资料,研究自20世纪90年代以来美国东部阔叶森林的物候在城市和农村间的差异。他们观察到在城市地区植物的生长季节大约延长了7.6天左右[12]。 Zhang等利用MODIS(中分辨率成像光谱)数据研究发现,在北美东部,相比农村地区,城市植物的生长季节约延长15天左右,并且这种影响随着距城市中心距离的增加而成指数递减,影响范围一直延伸到城市周边以外的10km范围内[23]。何兴元和赵桂玲认为,物候生长季节开始日期和生长季节结束日期有密切的同步相关性,并与物候季节节奏的长短呈负相关[28]。
目前虽然北半球的城市植被动态和物候已经被广泛研究,但是关于城市植被物候在南半球的研究很少。我们的研究目标是:(1)探讨悉尼市植被指数和物候的时间和空间变化;(2)比较它们在不同土地覆盖类型间的差异。
2.研究材料与方法
2.1研究区域介绍
研究区是澳大利亚的悉尼市,地处南半球,位于澳大利亚的东南部沿海。这里是新南威尔士州的首府。它不仅是澳大利亚第一大城市,也是这个国家人口密度最大的城市。在2015年,将近三分之二的新南威尔士州的人口(约484万人)居住在悉尼。研究区面积为12144.6km2。它属于副热带海洋性气候,全年降雨比较均匀,平均全年雨量是1217.0mm,上半年的雨量略高。气温最高的月份是1月,沿海地区的气温达18.6–25.8℃。气温最低的月份是7月,极端最低值是2.1℃。
2.2数据来源
增强型植被指数(EVI)数据来自MODIS的MOD13A1产品,时间范围涵盖从2001年1月1日到2012年12月31日,时间分辨率为16天,空间分辨率为500m。该数据从网上下载,网址为LP DAAC: https://lpdaac.usgs.gov/。EVI是专门设计用于降低背景反射率影响的植被指数,非常适合在城市地区的植被动态监测。
为了了解研究区不同土地覆盖类型的物候变化,下载了土地覆盖数据。该数据来自MODIS的MCD12Q1产品和动态的土地覆盖数据集(DLCD V1.0),其空间分辨率为500m。研究区有6个主要的土地覆盖类型:森林、城市、草原、热带稀树草原、农田和水体。
剩余内容已隐藏,请支付后下载全文,论文总字数:14961字
相关图片展示:
该课题毕业论文、开题报告、外文翻译、程序设计、图纸设计等资料可联系客服协助查找;

