论文总字数:15223字
目 录
1 引言 1
2.研究区域和方法 1
2.1研究区域和资料来源 1
2.1.1 研究区域概况 1
2.1.2 资料来源 1
2.2 研究方法 2
2.2.1 气候趋向率 2
2.2.2 Mann-Kendall检测法 2
2.2.3 克里金插值法 2
3.结果分析 3
3.1 研究区平均有效积温的空间分布 3
3.1.1 安徽省年平均有效积温 3
3.1.2 湖北省年平均有效积温 3
3.1.3 湖南省年平均有效积温 3
3.1.4 江苏省年平均有效积温 3
3.1.5 江西省年平均有效积温 3
3.1.6 浙江省年平均有效积温 3
3.1.7 六省年平均有效积温 3
3.2 研究区年平均有效积温的时间变化 4
3.2.1 安徽省年平均有效积温 4
3.2.2 湖北省年平均有效积温 4
3.2.3 湖南省年平均有效积温 5
3.2.4 江苏省年平均有效积温 5
3.2.5 江西省年平均有效积温 5
3.2.6 浙江省年平均有效积温 5
3.2.7 研究区平均有效积温 6
3.3 降水量对有效积温的影响 10
3.3.1 降水量对有效积温空间分布的影响 10
3.3.2 降水量对有效积温时间变化的影响 11
4. 结论与讨论 11
4.1 结论 11
4.2 讨论 12
参考文献 12
致谢 13
近50年长江中下游≥10℃有效积温的时空变化分析
周凌霄
, China
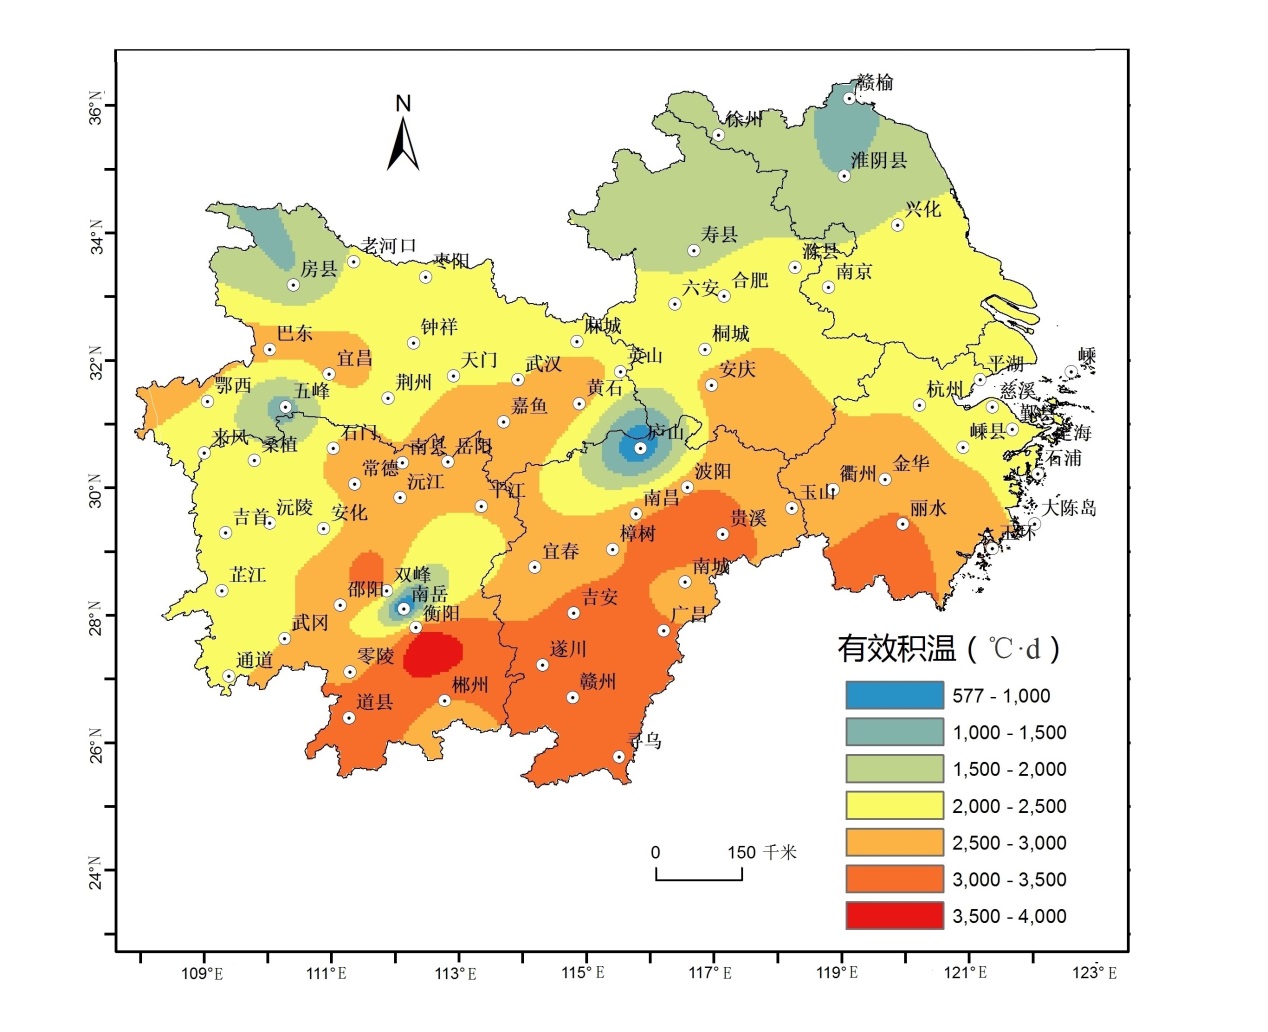
Abstract: Based on the daily mean temperature and precipitation data of 74 meteorological stations in the middle and lower reaches of the Yangtze River, the linear trend analysis, Mann-Kendall detection and ArcGIS-based common Kriging interpolation were used to determine the annual average of six provinces in the middle and lower reaches of the Yangtze River The spatial distribution of the accumulated temperature, the abrupt change characteristics and the spatial distribution of the change before and after the mutation and its relationship with the precipitation were analyzed. The temporal and spatial changes of the accumulated temperature in the middle and lower reaches of the Yangtze River were studied. The main results are obtained as follows. (1) The annual average effective accumulated temperature of the middle and lower reaches of the Yangtze River is 500-4000 ℃·d, and its spatial distribution is characterized by "less in the north and more in the south; (2)The annual average effective accumulated temperature in the middle and lower reaches of the Yangtze River showed a significant trend with the propensity rate of 86.365℃·d·(10a)-1, and the mutation rate increased in 2000. (3) The precipitation had an important effect on the temporal and spatial changes of the average effective temperature in the middle and lower reaches of the Yangtze River. On the whole, the areas with more precipitation have relatively much effective accumulated temperature, and vice versa. In recent 50 years, the average annual total precipitation in the middle and lower reaches of the Yangtze River is obviously increased, which is probably the main cause of the increase of the average effective accumulated temperature.
Key words: The middle and lower reaches of the Yangtze River; effective accumulated temperature; spatial-temporal changes; ArcGIS
1 引言
在一定界限温度范围内,作物才能正常生长发育,气候变化导致界限温度出现时间的改变,进而改变作物的生长发育。气温变化导致植物物候发生改变,通常,利用积温模型来量化植物物候期,有效积温决定植物物候[1-3]。10℃是喜温植物适宜生长的起始温度[4-7],≥10℃有效积温是衡量某地区热量资源的一个重要指标,其时空变化差异性直接影响着农业部局以及生态格局。
IPCC 第四次评估报告指出,近半个世纪全球地表气温的线性增暖速率几乎是近 100 a的两倍,气候呈现出显著增暖的变化特点[8]。相关研究也表明,长江中下游地区的气温也有明显的上升趋势[9]。随着气温的显著升高,长江中下游地区≥10℃有效积温的时空分布也发生了明显的变化[10]。霍金兰等[11]研究认为,近50年来江苏省日平均气温稳定通过10℃的有效日数和期内积温变化均呈显著增加的趋势。李迎春等[12]研究指出,近55年江西省日平均气温≥10℃积温和持续日数呈现增加趋势,初日呈现提前趋势,终日呈现推迟趋势,≥10℃积温的周期性变化规律保持一致,存在18年和30年的周期,且不存在区域性的差异,并且江西省≥10℃·d积温的气候倾向率分布相似,高值区大部分集中在北部,低值区大部分集中在南部。
长江中下游地区大部分地区属北亚热带,小部分属中亚热带,10℃以上活动积温达4500~5000℃,是我国主要水稻产区之一,长江中下游地区水稻产量占全国水稻总产量的一半左右,对于国家粮食安全具有重要意义[13]。因此,其有效积温的变化不仅对长江中下游的社会经济发展、农业生产具有重要影响,同时对我国的经济发展和农业生产也将产生广泛而深刻的影响。本文拟在前人研究工作的基础上,选用长江中下游地区内74个气象站点的气候数据,结合ArcGIS,分析1961-2010年长江中下游年平均有效积温的时空变化及其与降水量的关系。这对长江中下游地区农业应对气候变化、调整种植区划和农业生产布局及国家粮食安全等都具有十分重要的意义。
2.研究区域和方法
2.1研究区域和资料来源
2.1.1 研究区域概况
长江中下游地区,是指中国长江三峡以东的中下游沿岸带状平原,为中国三大平原之一,地跨湖北、湖南、江西、安徽、江苏、浙江6省,素有“水乡泽国”之称,由长江及其支流冲积而成,面积约20多万平方千米,地势低平,海拔大多50米左右。长江中下游平原年均温14~18℃;1月均温0~5.5℃;7月均温27~28℃,绝对最高温可达38℃以上。年降水量1000~1500毫米,季节分配较均,无霜期210~270天,10℃以上活动积温达4500~5000℃。该区域属亚热带季风气候,冬季温和少雨,夏季高温多雨。春夏季降水较多。每年6至7月受夏季风和北方冷空气的影响,形成“梅雨”,出现长时间的连阴雨天气。梅雨季节时间的长短受“江淮准静止锋”的影响大。梅雨季节过后受西太平洋副热带高压影响,且少台风活动,会形成“伏旱”。因此,长江中下游地区是我国重要的粮、棉、油生产基地[14]。
2.1.2 资料来源
选用长江中下游六省内74个气象站近50年的逐日平均气温、降水量等资料,研究分析近50年长江中下游10℃以上有效积温的时空变化规律及其与降水量的关系。研究地区和所选气象站点的分布情况见图1。
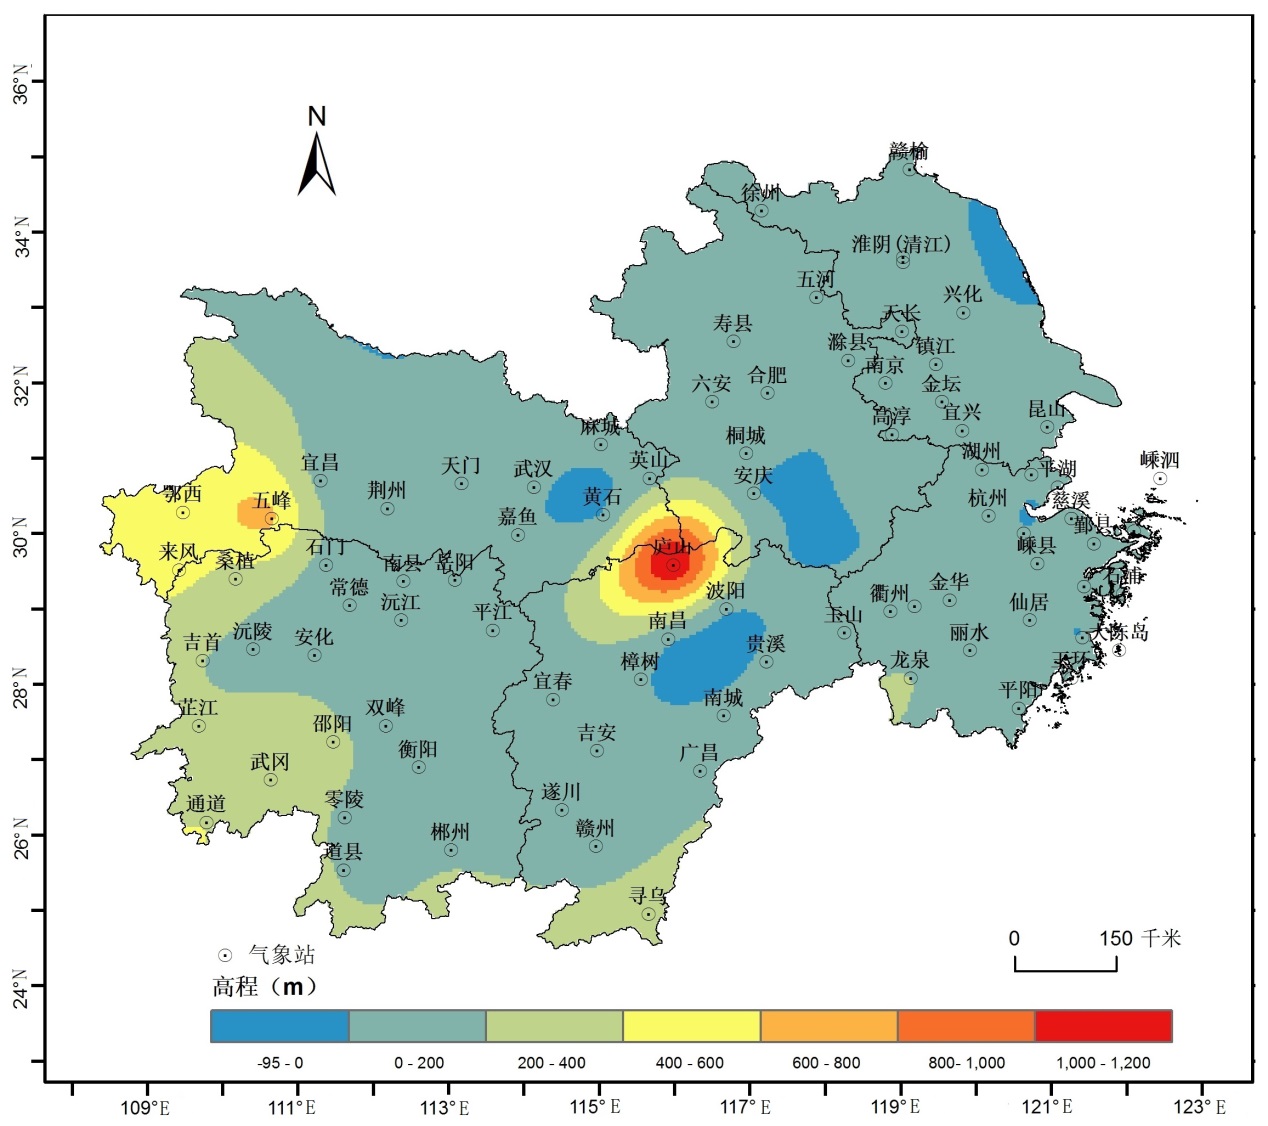
图1 长江中下游高程和气象站点分布
剩余内容已隐藏,请支付后下载全文,论文总字数:15223字
相关图片展示:
该课题毕业论文、开题报告、外文翻译、程序设计、图纸设计等资料可联系客服协助查找;


